
Background
A lot of investors don't see anything to be happy about. Weakness in the second half of 2015 has carried over into 2016 with even more momentum. Hedge funds finished 2015 with some of the worst numbers since 2008, and started 2016 under punishing market conditions. The downdraft has coincided with a period where positions that are crowded (i.e had a high percentage of hedge fund ownership) have dramatically underperformed the market.
During market stress some positions will suffer more than others. In a prior report., we reviewed the impact of the late summer 2015 selling pressure on positions with high hedge fund ownership. The August market was experiencing similar convulsions as the opening of 2016, and our hypothesis entailed positions with a high concentration of hedge fund ownership as a percentage of the institutional float were under pressure. They were. They dramatically underperformed the market, but our findings also suggested that these positions may recover more quickly than the market.
Today, we revisit the findings of our prior report to assess how crowded hedge funds names have been performing and which names have had the largest effect on performance. Also, for the first time, we have created a list of the hedge funds with the most crowded positions. Hedge funds and their allocators usually track whether they have exposure to crowded positions, as they understand that these positions may have different risk characteristics than positions that are not crowded. However, its often hard for a hedge fund or an allocator to be able to benchmark their degree of crowdedness relative to peers. They may know whether a position is owned by a large number of HFs, but is that low or high relative to other funds?
For the first time, Symmetric rank orders hedge funds by their exposure to a hedge fund crowding factor.
The Symmetric High Hedge Fund Exposure Index
The Symmetric Hedge Fund Exposure Index tracks positions in which hedge fund managers comprise a large percentage of the publicly traded float of the stock. By comparison, these positions are more likely to have their shares owned by hedge fund managers than other institutions. We will often refer to these positions as "crowded" positions.
The Symmetric High Hedge Fund Exposure Index is particularly susceptible to movements when hedge funds trade as a group. If hedge funds are liquidating positions, their trading as a group may have an outsized impact on stocks in which they make up a large percent of ownership. The trading may be forced selling, for example, to reduce risk or otherwise.
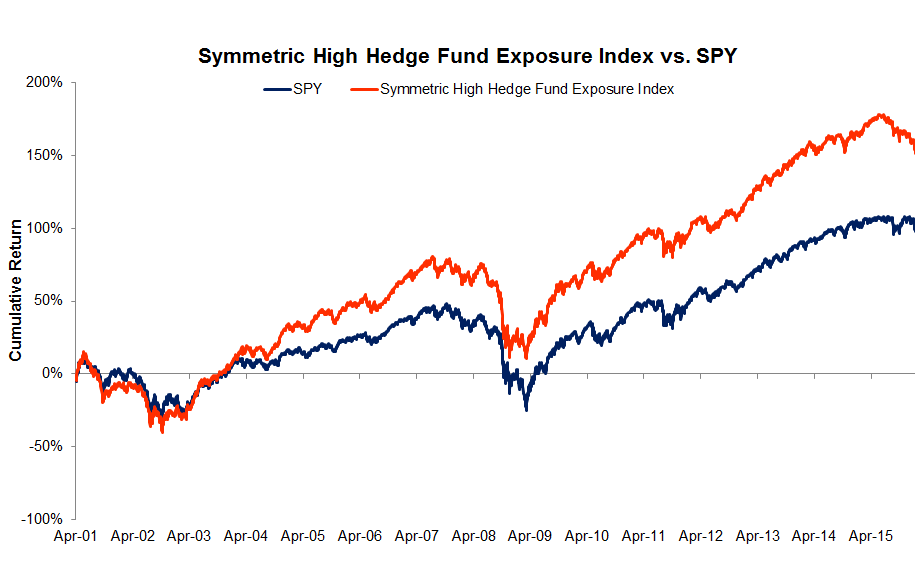
We first isolate the stocks that have highest percentage of hedge fund ownership. Then, we narrow it to a list of fifty stocks that have over 5BN in publicly traded float. The resulting index is available for comparison against individual manager return streams and other indices through access to the premium functionality of Symmetric.io. The chart below illustrates the performance of the Symmetric Hedge Fund Exposure Index vs the SPY since 2001.
The Symmetric High Hedge Fund Exposure Index In Context
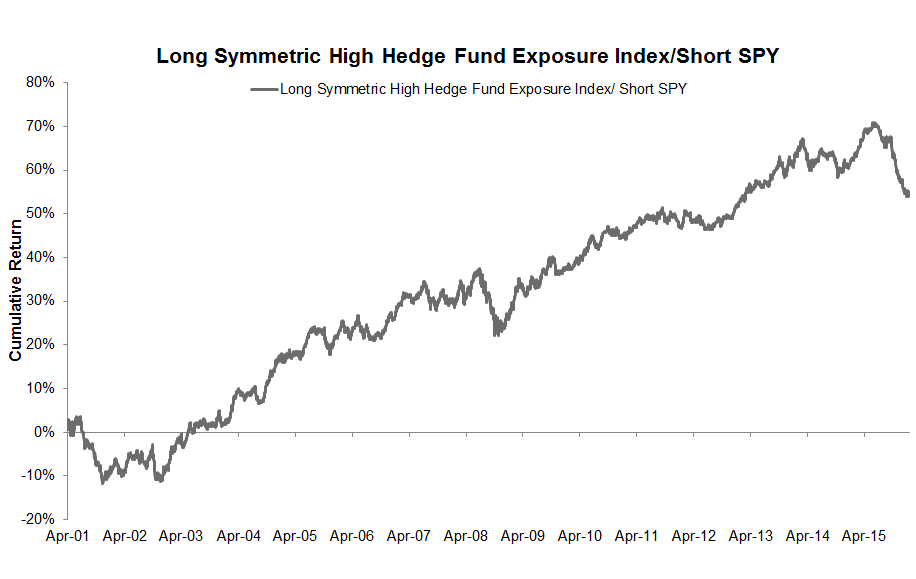
Stocks where hedge funds own a large percentage of the float tend to outperform the SPY by about 3.6% a year. Moreover, the Symmetric High Hedge Fund Exposure Index has historically recovered well from periods of stress. The chart below shows the returns of being long the Symmetric High Hedge Fund Exposure Index and short the SPY. The out performance of this index over the SPY is relatively consistent, with the largest drawdown prior to the current drawdown occurring in 2008.
The current drawdown from peak is slightly greater in magnitude than the drawdown in 2008, as illustrated by the graph below which shows the drawdown from peak from being long the Symmetric High Hedge Fund Exposure Index and short the SPY.
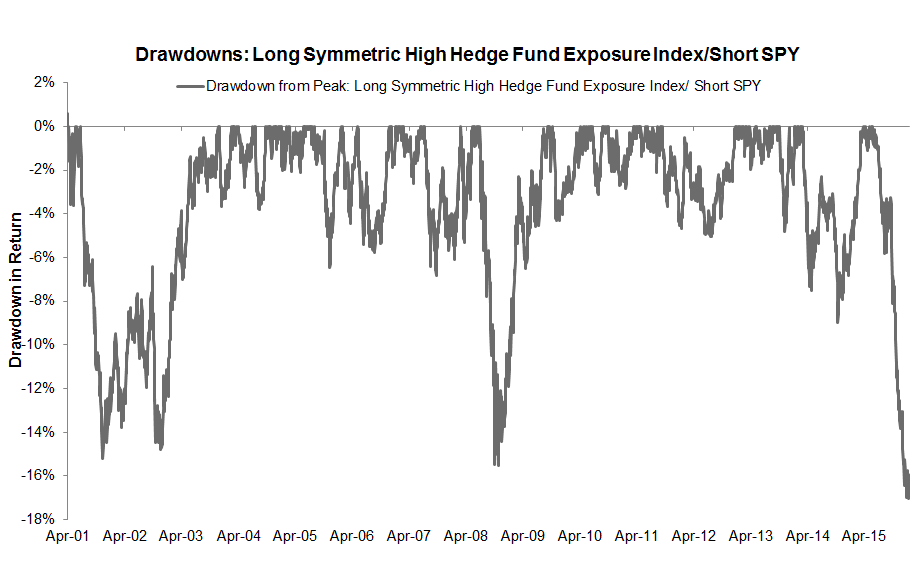 In each of the historic cases, the recovery in the Symmetric Index has been stronger than the market in general. Since we don't see anything fundamentally different about the market or the nature of participants in this drawdown compared to the previous, we would expect the index to recover relative to the broader market.
Which Crowded Stocks Have Suffered the Most This Year?
Some of the worst hit stocks may offer opportunities for buying by investors who seek to profit from the historical outperformance of crowded hedge fund names vs. the market. The table below shows 10 stocks amongst the 50 stocks that make up the Symmetric High Hedge Fund Concentration Index that have been hit the hardest YTD:
Biggest YTD Losers Amongst High Concentration HF Names
| Ticker | Name | Sector | % of Inst. Float owned by HFs | YTD Stock Move | 2015 Stock Return |
|---|---|---|---|---|---|
| WMB | Williams Cos. (The) | Energy | 32% | -47% | -39% |
| LBTYK | Liberty Global Inc. Series C | Cons. Disc. | 28% | -20% | -9% |
| FLT | FleetCor Technologies Inc. | Tech | 45% | -18% | -4% |
| JD | JD.COM INC ADR | Cons. Disc. | 51% | -16% | 39% |
| VRX | Valeant Pharmaceuticals International Inc (ONT) | Health | 32% | -16% | -29% |
| DOW | Dow Chemical Co. | Materials | 19% | -15% | 17% |
| AVGO | Avago Technologies Limited | Tech | 23% | -15% | 46% |
| ENDP | Endo Internation | Health | 38% | -14% | -15% |
| AMZN | Amazon.com Inc. | Cons. Disc. | 9% | -14% | 118% |
| PCLN | Priceline Group Inc | Cons. Disc. | 11% | -14% | 12% |
Which Managers Have The Most Crowded Portfolios?
We analysed every hedge fund manager in the Symmetric universe to understand how much exposure they have to high concentration hedge fund ownership or crowdedness. To do so, we followed a few steps:
First, we calculated the HF ownership as a percentage of institutional float for each stock in the Symmetric universe. This measures whether hedge funds as a group own a large percentage of the stock's float. A stock that has a high percentage of its float controlled by hedge funds is defined as being crowded.
Second, using the score calculated for the first step, we derive an aggregate score for a manager's positions based upon taking a weighted average crowdedness score for each stock in their portfolio (the weight used is the the size of each position). To illustrate, lets assume that manager A has a 50% position in Stock X and a 50% position in Stock Y. Stock X has 10% of its inst. float owned by hedge funds, while stock Y has 60% of its float owned by HFs. In that case the crowdedness score for the manager would be (50% * 10%)+(50% * 60%) = 35%. The crowdedness score for a manager therefore measures on average how much of their position's float in owned by hedge funds as a category.
Based upon this crowdedness measure we are able to rank the hedge funds in the Symmetric universe. The list is shown below along with the YTD StockAlpha and Absolute Return of their 13-F Portfolios:
HFs with Most Crowded Portfolios
| Fund | Crowdedness Score | YTD StockAlpha of 13F portfolio | YTD Absolute Return of 13-F Portfolio |
|---|---|---|---|
| Icahn Associates Corp | 53% | -3.4% | -11.6% |
| Hillhouse Capital Management Lt | 45% | -8.4% | -14.6% |
| Orange Capital Llc | 41% | -4.3% | -10.8% |
| RA Capital Management Llc | 40% | -17.4% | -25.3% |
| Baupost Group Llc | 39% | -2.8% | -12.1% |
| Broadfin Capital Llc | 38% | -10.7% | -19% |
| Naya Management Llp | 36% | 0.7% | -6.9% |
| Raging Capital Management Llc | 36% | -3.7% | -11.7% |
| Marble Arch Investments Lp | 34% | -3.8% | -11.8% |
| 12 West Capital Management Lp | 33% | -9.4% | -16% |
| Perceptive Advisors Llc | 33% | -13.6% | -23.2% |
| North Run Capital Lp | 32% | -3.8% | -11.2% |
| Pershing Square Capital Mgmt | 31% | -5.7% | -14.1% |
| Paulson & Co | 31% | -0.9% | -8.7% |
| Deerfield Management | 31% | -7% | -14.8% |
| Miura Global Management | 30% | -3.3% | -10% |
| Sachem Head Capital Management | 30% | -1.4% | -9.2% |
| Fir Tree Incorporated | 30% | -4.4% | -12.3% |
| Brahman Capital Corporation | 30% | -3.1% | -10.3% |
| SRS Investment Management Llc | 30% | -4.8% | -14.1% |
One thing that stands out in the table above is that almost all the funds on the list have significantly negative YTD StockAlpha. Put in other words, on a market, beta and sector neutral basis, their long positions are producing significant negative alpha. The implication is that hedge fund crowdedness is a factor that hedge funds and allocators should be paying attention to as it may be driving recent under performance. It may not be enough to just calculate the crowdedness score for a portfolio, but to also benchmark the score against a fund's peers to truly get perspective on whether a portfolio is likely to suffer in a downturn.